Diagnostics
The health dashboard shows device status, operating data, messages, and the diagnostic file.
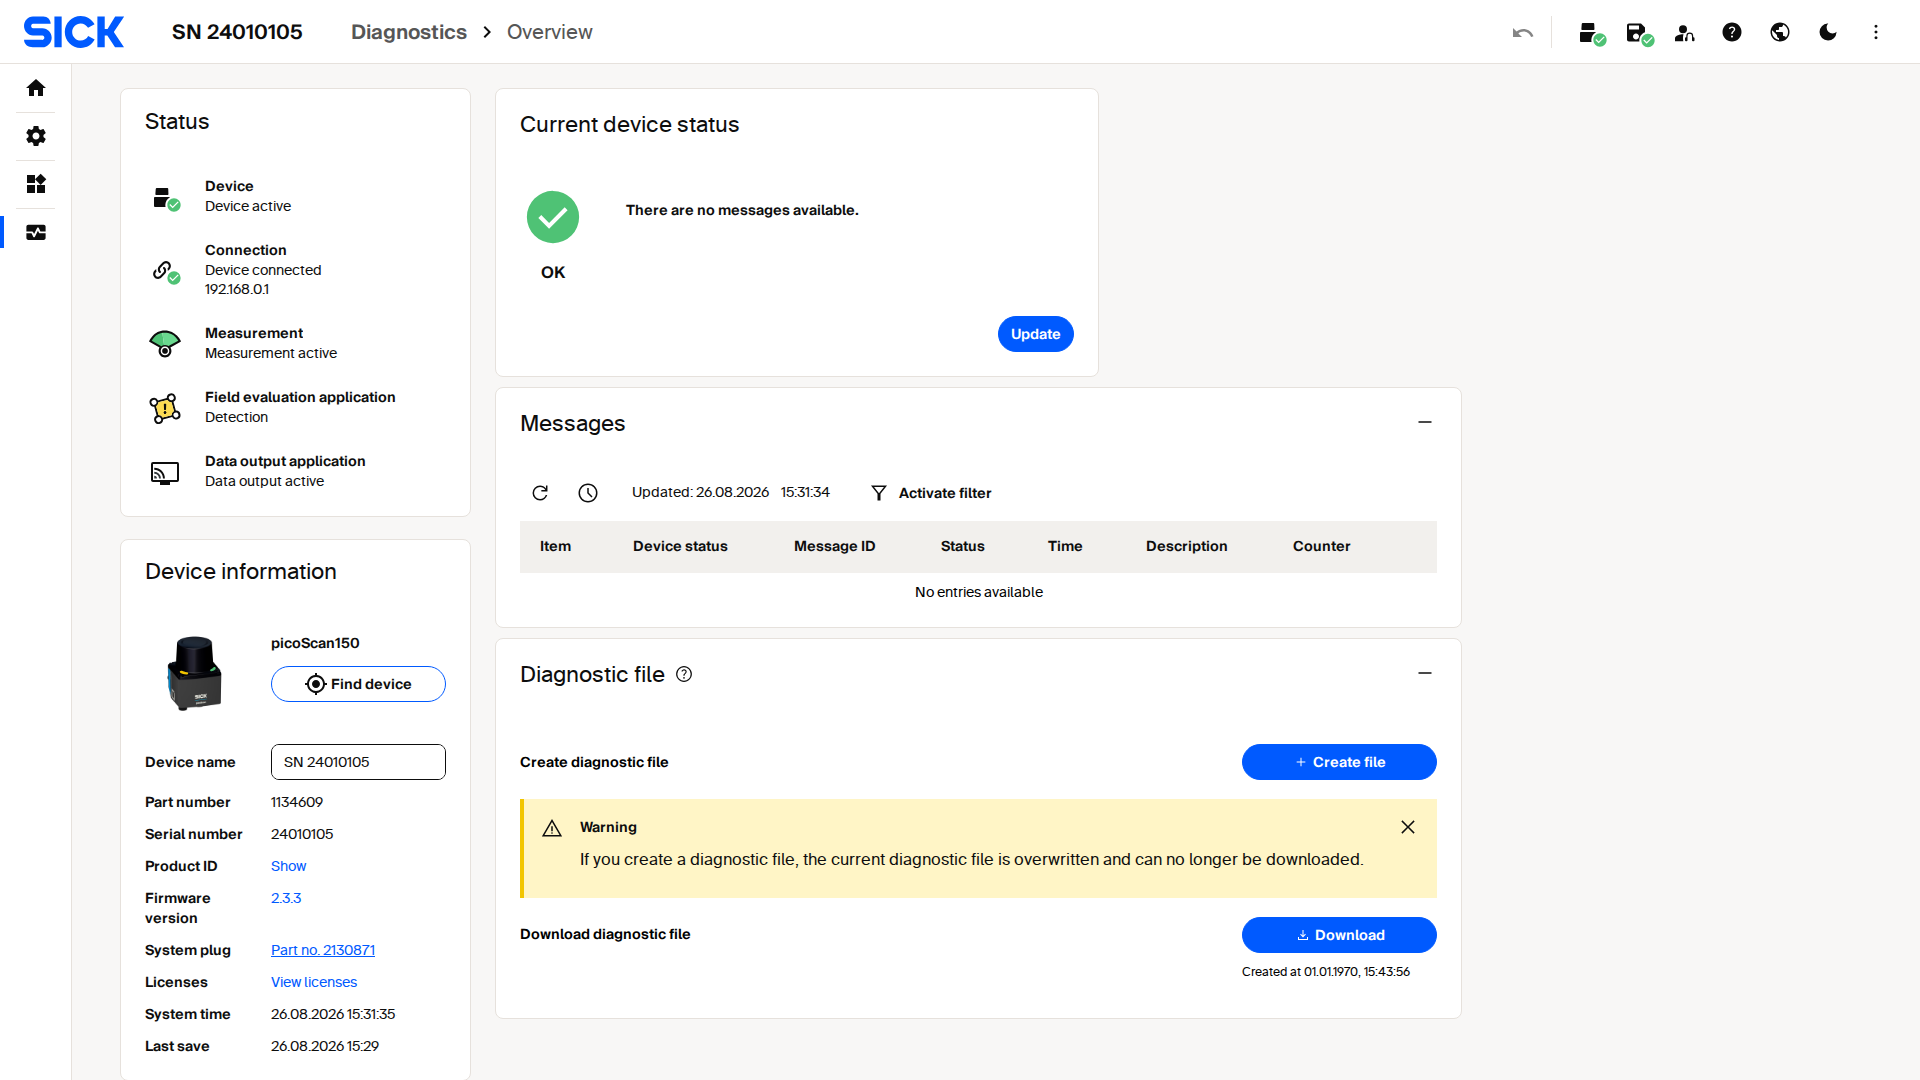
Live capture from a picoScan100's web interface. Try it yourself in the Virtual Sensor Lab.
The dashboard shows device, connection, measurement, and data-output status at a glance. It also displays the power-on counter, operating hours, temperature, and most recent parameterization. Its event log records messages with their severity, ID, time, and description, and it can be filtered. You can create and download a diagnostic file for SICK service.
Creating a new diagnostic file overwrites the previous one.
Cybersecurity
Harden the sensor by managing certificates and switching network services on or off.
Live capture from a picoScan100's web interface. Try it yourself in the Virtual Sensor Lab.
Use this page to create an HTTPS certificate for encrypted access and enable only the required services and protocols, such as CoLa, device search, the web server, HTTPS, or SSH. Each row shows its purpose and physical and logical port to support firewall planning. Disable legacy protocols and developer access in production.
Detection history
Record and review how often each field evaluation triggered.
Live capture from a picoScan100's web interface. Try it yourself in the Virtual Sensor Lab.
Start or stop recording detections across all evaluation groups. Choose which groups and fields to include. The statistics section shows the detection count per evaluation as live bars. A link jumps to the field evaluation to adjust fields.