Application
Data output
Decide what measurement data leaves the sensor and how it is streamed to your system.
Live capture from a picoScan100's web interface. Try it yourself in the Virtual Sensor Lab.
For data output, select Compact, MSGPACK, LMDscandata, or Native ROS 2 according to your application. For Compact or MSGPACK, configure serialization to include only the RSSI and properties layers your application needs. Reduce bandwidth at the source with an angular-range filter that retains one sector or an interval filter that reduces the number of points.
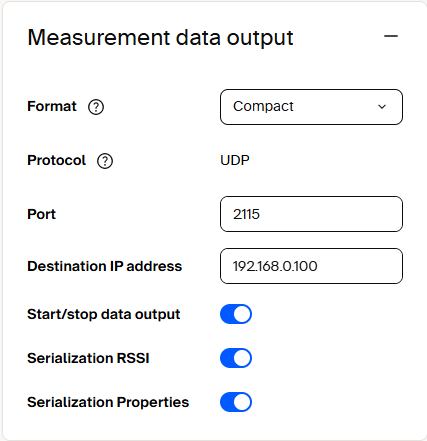
Compact outputs measurement data over UDP and provides separate controls for RSSI and properties serialization.
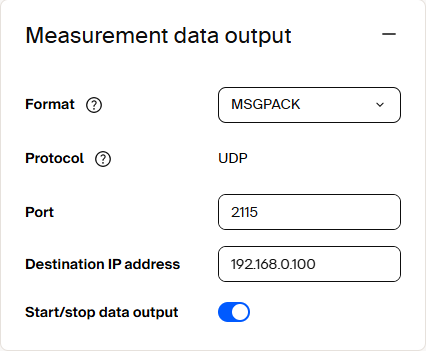
MSGPACK outputs measurement data over UDP to the configured destination address and port.
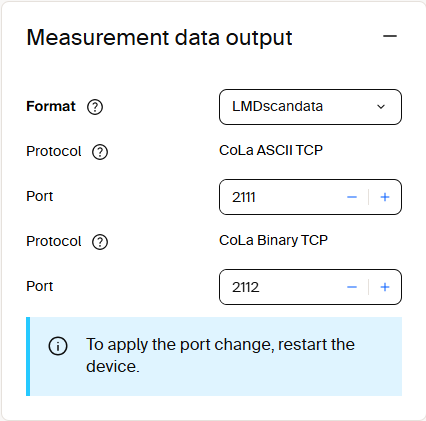
LMDscandata provides CoLa ASCII and CoLa Binary TCP ports. Restart the sensor after changing a port.
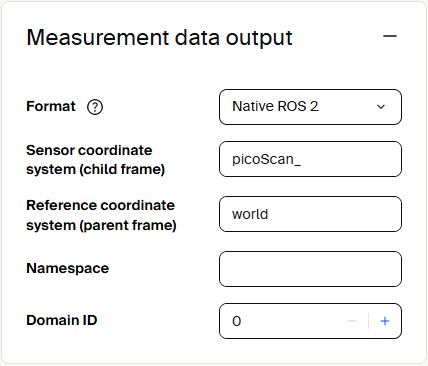
Native ROS 2 configures the sensor and reference coordinate frames, namespace, and DDS domain ID.
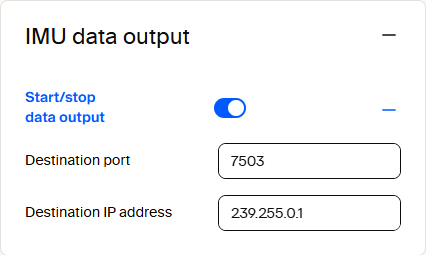
The IMU data output panel enables IMU streaming and configures the destination port and IP address.
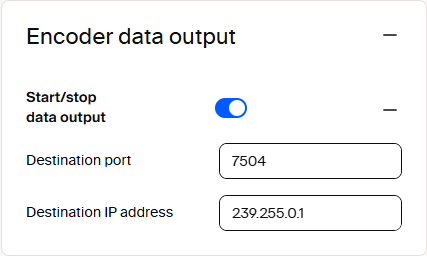
The Encoder data output panel enables encoder-data streaming and configures the destination port and IP address.
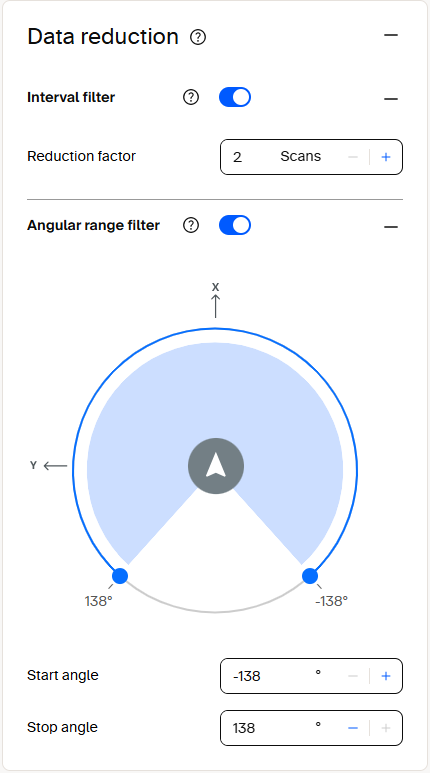
The Data reduction panel reduces the transmitted data with an interval filter and an angular range filter.
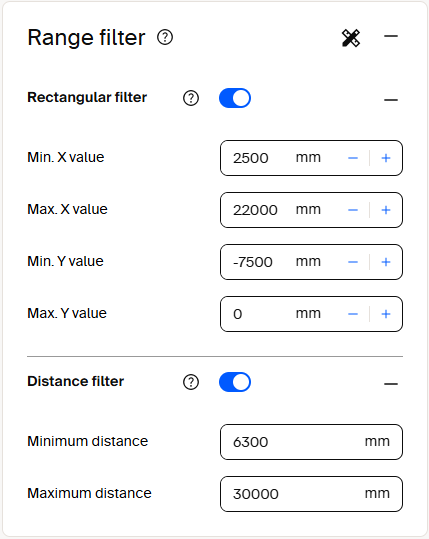
The Range filter panel limits data by rectangular X/Y coordinates or by minimum and maximum distance.
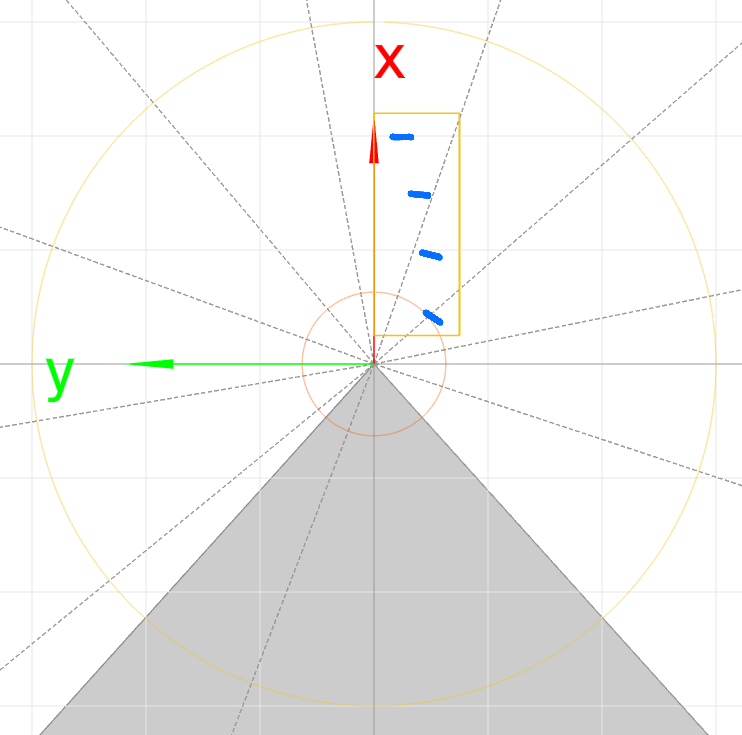
The scan view shows the selected region of interest and the points detected within it.
Data streaming related articles
- How to receive Compact measurement data with UDP multicast
- How to enable Compact measurement data with UDP unicast
- How to enable LMDscandata with CoLa A over TCP
- How to read and understand LMDscandata
Field evaluation
Draw 2D detection fields and let the sensor decide, on the device, when something enters them.
Live capture from a picoScan100's web interface. Try it yourself in the Virtual Sensor Lab.
Fields are 2D zones that you draw around the sensor in its scan plane. The sensor reports a detection when points fall inside a field. Evaluation groups combine fields with logic and produce an actionable result. A field state can drive a physical output (see Inputs and outputs) or appear in the detection list for your software. A group can remain active continuously or be switched by an input, for example to monitor a zone only while a machine is moving. Pan and zoom the scan view to check field coverage across the full aperture angle.
Because the evaluation runs on the sensor, this detection works without an external computer.
A quick click-through of adding a detection field in the web UI. Every field lives inside an evaluation group that pairs the field geometry with the logic and output reacting to it.
Live capture of creating a detection field on a picoScan100. Try it yourself in the Virtual Sensor Lab.
- On the Field evaluation panel, click Add group to create an evaluation group.
- The group opens an evaluation chain: Field → Evaluation → Output.
- Click the Field node to define the field geometry: draw a contour, or use Teach-in to capture the current environment as the field.
- Set the evaluation logic and wire the result to an output; the field then appears live in the 2D view.
- Click the floppy-disk icon in the toolbar to save the configuration permanently (until you do, changes live in RAM and are lost on restart).
New evaluation groups can only be created in the web UI or by restoring a configuration that already contains them. Once they exist, the REST API can modify their contours and activate them at runtime.
Field evaluation related articles
- How to switch digital outputs by API
- How to manipulate field contours through REST
- How to read field evaluation state through HTTP
- How to activate fields through HTTP
- How to draw fields and detect objects
- How to receive contamination indication through event-driven CoLa
- Distance-dependent parameter
- How to use the REST API client
- How to receive field evaluation state via event-driven CoLa
- How to draw fields and detect objects
- How to use the object history feature
- How to use a contour as a reference
- How to use a taught background for field evaluation
- How to visualize detection-history bounding boxes
Perpendicular distance measurement
Measure the perpendicular distance from the sensor's scan line to the nearest object inside a zone, and stream that distance as a live result.
Live capture from a picoScan100's web interface. Try it yourself in the Virtual Sensor Lab.
Like field evaluation, detection runs on the device inside evaluation groups, but the result is a distance value rather than a simple field-clear/field-infringed state.
Each group holds a Perpendicular distance measurement evaluation that reports how far the closest object is, measured perpendicular to the scan. Read the live values from the Result list for distance measurement, or over the REST API / WebSocket events. Object detection tuning keeps the reading stable. The Max. blanking size setting ignores gaps smaller than the set width, and the Detection time setting sets how long an object must be present (in scans) before it counts.
- On the Perpendicular distance measurement panel, click Add group.
- Draw the zone the measurement applies to, the same way you draw a field.
- Set Max. blanking size and Detection time under Object detection to match your target and required responsiveness.
- Read the distance in the Result list for distance measurement, or wire it into your software over the API.
- Click the floppy-disk icon to save the configuration permanently (until you do, changes live in RAM and are lost on restart).
Because the measurement runs on the sensor, you get a ready-to-use distance value without processing the raw scan on a host.
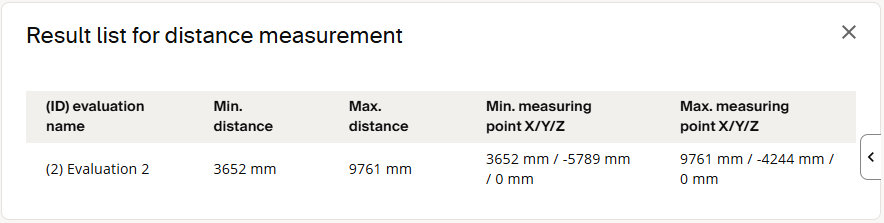
The Result list shows the minimum and maximum distance and the coordinates of the measuring points for each evaluation.
This video shows how to receive measurement data via CoLa.